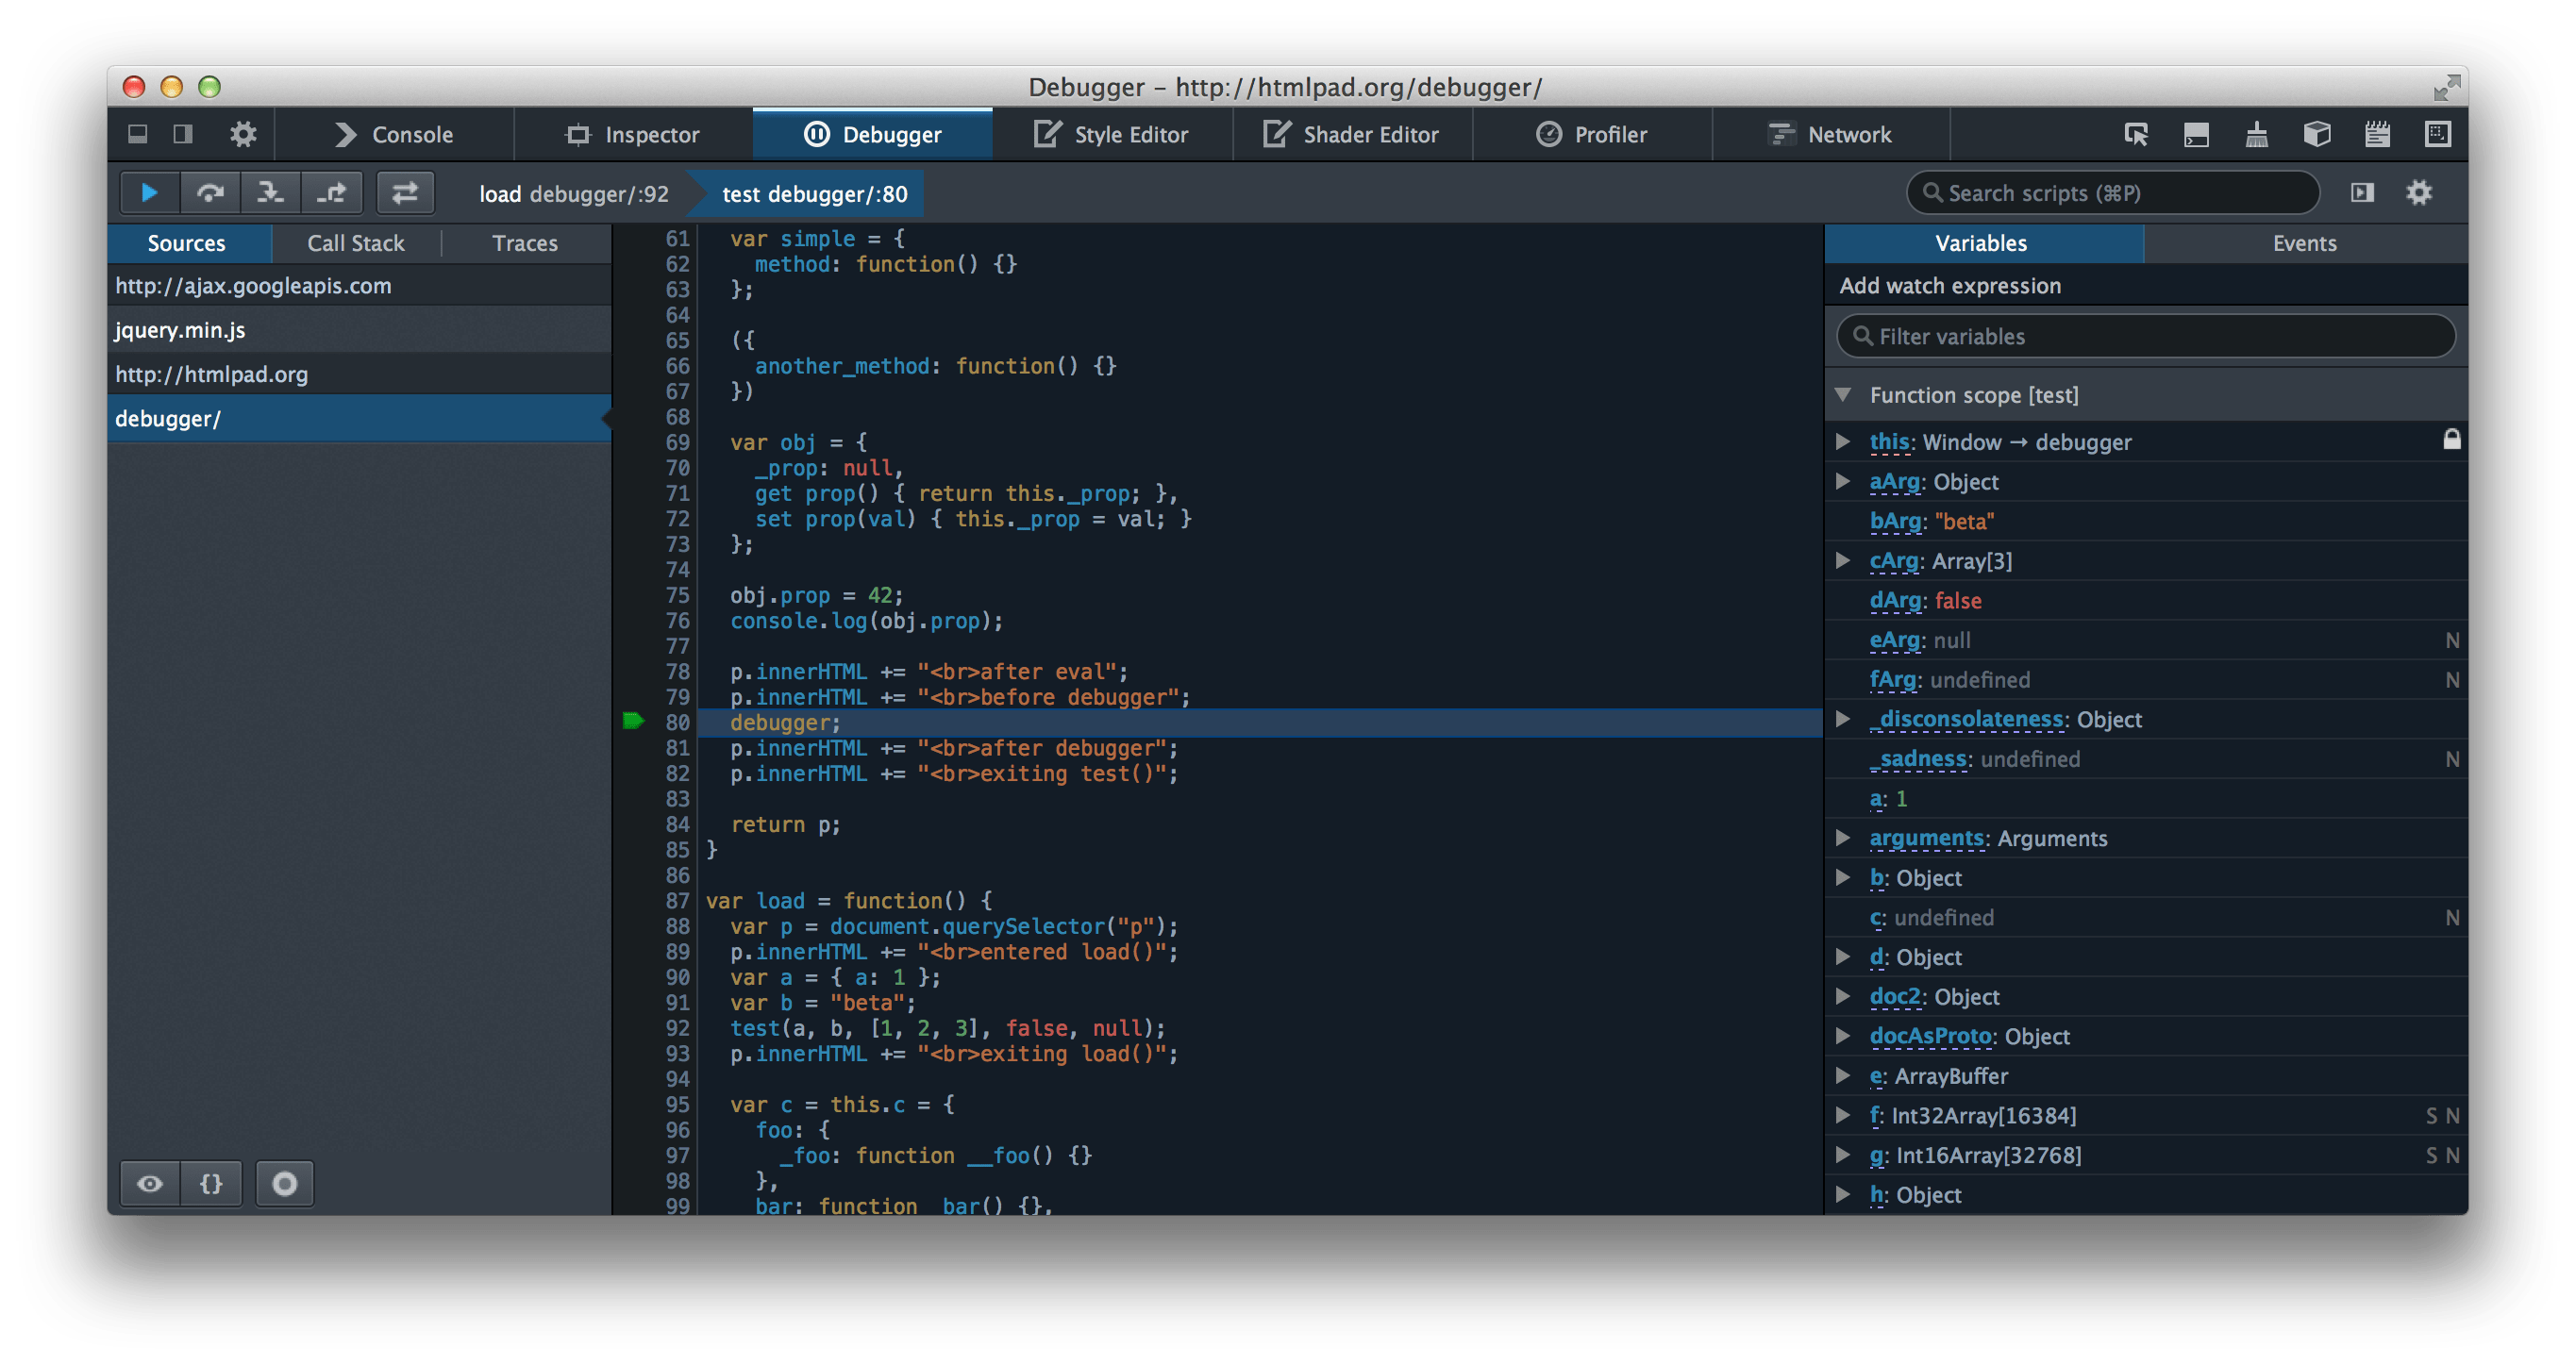
js debugger
The debugger statement invokes any available debugging functionality, such as setting a breakpoint. If no debugging functionality is available, this statement has no effect.
Programming code might contain syntax errors, or logical errors.
Many of these errors are difficult to diagnose.
Often, when programming code contains errors, nothing will happen. There are no error messages, and you will get no indications where to search for errors.
Searching for (and fixing) errors in programming code is called code debugging.
Examples
Using the debugger statement
The following example shows code where a debugger statement has been inserted, to invoke a debugger (if one exists) when the function is called.
function potentiallyBuggyCode() {
debugger;
// do potentially buggy stuff to examine, step through, etc.

}
When the debugger is invoked, execution is paused at the debugger statement. It is like a breakpoint in the script source.

Debugging is not easy. But fortunately, all modern browsers have a built-in JavaScript debugger.
Built-in debuggers can be turned on and off, forcing errors to be reported to the user.
With a debugger, you can also set breakpoints (places where code execution can be stopped), and examine variables while the code is executing.
Normally, otherwise follow the steps at the bottom of this page, you activate debugging in your browser with the F12 key, and select “Console” in the debugger menu.
- The console.log() Method
If your browser supports debugging, you can use console.log() to display JavaScript values in the debugger window
- Setting Breakpoints
In the debugger window, you can set breakpoints in the JavaScript code.
At each breakpoint, JavaScript will stop executing, and let you examine JavaScript values.
After examining values, you can resume the execution of code (typically with a play button).